This project analyses data from the US patent citation database. Patent citations are interesting because they have been shown in several studies to be indicators of the value of patents. Previous studies have mainly used traditional data analysis techniques (simple counts of citations). The present study uses network analysis techniques borrowed from social networks and web analysis tools such as the PageRank algorithm. The purpose is to see whether these techniques can be used to better analyse patent citation networks.
The Data
We use patent citation data from US patent citations covering the period 1976 to 2006. The data is available from the National Bureau of Economic Research (NBER) at https://sites.google.com/site/patentdataproject/Home/downloads.
The data is a simple list of node pairs (citing, cited) where each node is a US patent document. This can be used to construct a directed acyclic network (DAG).
Patent citations are interesting because patent documents represent new technological solutions to industrial problems. Patent applicants and examiners are required to cite related documents as part of the patent granting process. This means that citations are a good indicator of links between related technological innovations.
A secondary dataset available at NBER (pat76_06_ipc) includes technology classifications which are manually assigned by patent examiners. This dataset can be used as a reference for identifying different fields of technology. There are more than 200,000 possible technology classifications used by examiners, but the classification system is hierarchical and so one can choose a level at which there are around 1000 classification groups that represent high-level technologies such as “pharmaceutical compounds”, “electrical components”, etc.
There are limitations to this dataset. It is relatively old and it only covers US patents. However the purpose is to show how network analysis can be used, not to derive specific insights from more recent patent data.
The data was first analysed in Hall et al. (2001) in a paper which looked at some of the characteristics of the data and proposed some methodological solutions to problems such as citation lags and publication delays that skew the data in certain ways.
In 2001, the algorithms and computer resources for large network analysis were relatively limited and so no network analysis was done. Since then, other authors have applied more advanced techniques, however in the context of this project we will not do a full literature review.
Research Questions
We will explore some questions to see what patent citations can tell us about the structure of innovation.
First, we will characterize the dataset and compare it with other similar datasets to answer the following questions:
- Is the network connected and how do its connectivity and clustering compare with other similar networks?
- What is the degree distribution of the network? Does it follow a power law and how does this compare with other similar networks?
Then we will attempt to answer some questions to explore what the citation network can tell us about the nature of innovation. The following question will be asked:
- Can the patent citation network be used to group similar patents into communities?
- Do these communities accurately represent technologies?
- Are different technologies more or less connected? This question is intended to identify whether some technologies consist of inventions that are more or less independent, or whether innovations tend to be highly inter-connected. This can have policy implications. For example, highly crowded fields are likely to be very competitive and incur costs for litigation and cross-licensing. Efficiency can be improved by policy interventions that encourage patent pooling or cross-licensing.
- Are there spill-over effects from one technology to another? This question is also interesting from a policy perspective because it may be a measure of how new ideas diffuse through society and stimulate further innovation in unrelated areas.
- Can we identify foundational patents which represent a major step in a technology? This information may be interesting to estimate the commercial value of a patent, for example.
Methodology
The data is loaded into a directed graph using the networkx python library.
Connectivity is measured by parsing the network for the number and size of connected components.
Clustering uses the average clustering coefficient which measure the number of triangles as a proportion of the number of connected triplets.
To measure the mean in-degree and out-degree, we use the networkx library to calculate:
We then move on to community detection. The Louvain community detection algorithm iteratively joins nodes into larger and larger communities, finding the grouping at each iteration that maximizes modularity. Modularity is a measure of how nodes in the same group are affiliated:
Modularity will give us a good indication of the degree of connectedness within and between the communities.
To test whether the Louvain communities represent technologies, we will look at the distribution of technology classifications in the communities vs the population of all patents (see the description of technology classifications above). This will be done with a simple multinomial probability test for each of the detected communities. If successful, we can then say that a Louvain community represents a group of technologically-related patents.
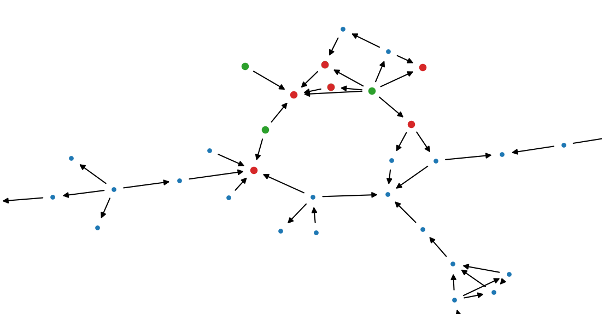
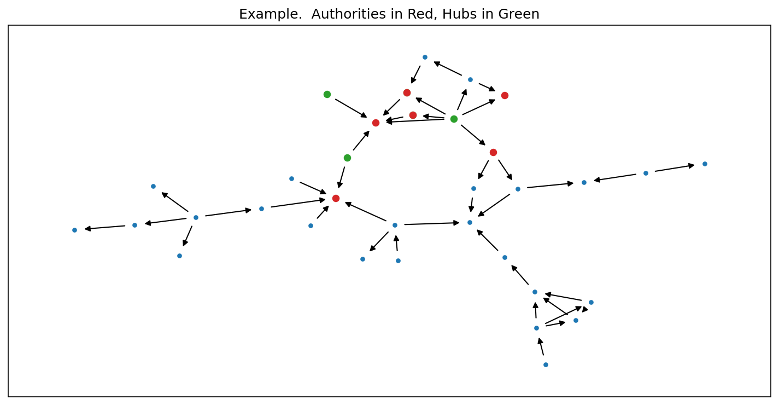
Finally, we can use Hubs and Authorities to identify important or foundational patents in each community. In the hub/authority model, an authority is a node which contains important information, and a hub is a node which is important because it points to important nodes. An authority is pointed to by many hubs, and a hub points to many authorities.
Results of Characteristic Tests
Data was loaded from the NBER citation dataset and used to create a DAG. The following characteristics were observed.
- Nodes: 3,155,172
- Edges: 23,650,891
- Average clustering coefficient: 0.0497
- Mean in-degree: 7.496
- Mean out-degree: 8.496
Nodes have high in- and out-degrees, but the clustering coefficient is quite low.
Statistics were also collected on the connectivity of the network:
- Number of Connected Components: 2221
- Count nodes in the largest 20 components:
- [6, 6, 6, 6, 6, 6, 6, 6, 6, 6, 6, 6, 6, 6, 6, 6, 7, 8, 10, 3150114]
- 99.2% of all the nodes are in one very large component.
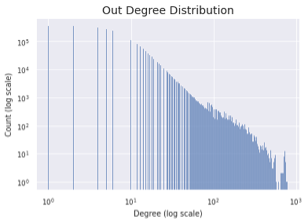
The degree distribution was computed for each node and then modelled using the power law distribution:
For this network, we measured the power law alpha parameter as : 2.96
The graphics below show that the degree distribution is visually linear on a log-log plot, which indicates a good power law fit.

Compare these results with the table from Newman (2010) which show typical values for a variety of different networks:
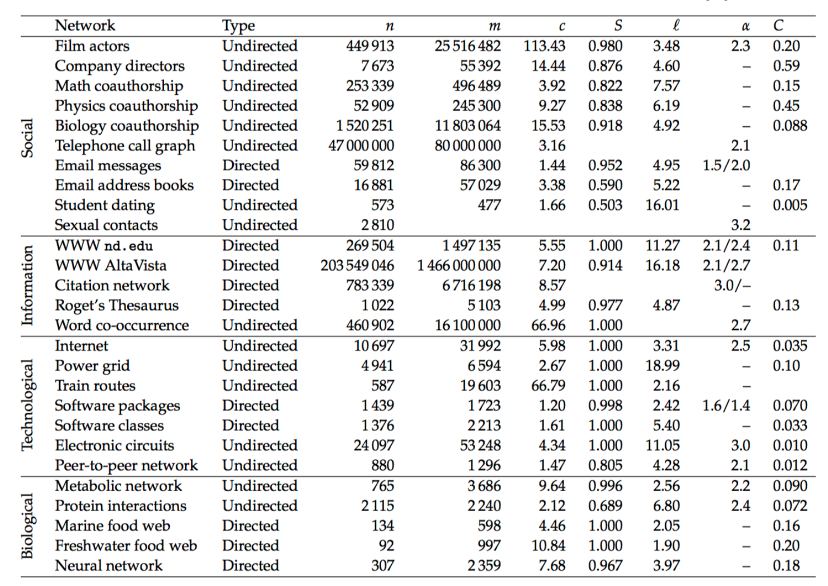
For comparison, the NBER patent citation network has the following characteristics:
| Network | Type | n | m | c | S | L | a | C |
| Pat Cit | Directed | 3,155,172 | 23,650,891 | 7.496 8.496 | 0.992 | 2.96 | 0.0497 |
Preliminary Conclusions
This network is very similar to other directed networks such as academic citations or the internet. It is highly connected, and follows a power law degree distribution. It is not highly clustered, but this is typical of similar directed networks which do not tend to have triangular relationships, partly because they are acyclic.
This conclusion shows that we have a typical directed acyclic network with no obvious defects and we can continue with some more advanced analysis.
Results of Community Detection
The Louvain community detection algorithm was run. This results in a partition of the network with the following characteristics:
- Number of communities: 2267
- Average community size: 1392
- Modularity of partition: 0.803
This already indicates that the algorithm was able to detect a high-level structure in the data with a high modularity. The average is not a good measure of the distribution, which is very skewed with a large number of communities with only 2 nodes, and a maximum of 241,598 nodes in the largest community.
We now need to test whether the Louvain communities actually correspond to high level technology classifications. To do this, we compare the distribution of technology classifications in the sample communities with the overall population distribution.
Recall that the technology classifications are assigned by patent applicants and examiners, similar to a library classification system. They are symbols such as ‘A61K’ (Pharmaceuticals), ‘H01L’ (Semiconductors), etc. We can extract these symbols from the NBER patent dataset, compute the population probability for each symbol, and then compare these with the samples from the Louvain communities.
This is a multinomial probability calculation – “what is the probability of drawing this sample distribution from the population distribution?”.
Given the time constraints, this test has been performed on a small sample of the 2267 communities. The multinomial probability is near zero for the cases tested, i.e. the distribution of technologies is not random, it is significant.
From this, we can conclude that the Louvain communities represent technology groupings and can be used to study hypotheses about a technology field.
Results of Hubs and Authorities
For this test, just one Louvain community was selected, with a size of 1434 nodes. The networkx HITS library was used to analyze hubs and authorities within this subgraph.
The HITS algorithm finds authorities (should contain important information) and hubs (should point to important authorities). The results from analysing the chosen subgraph are:
Top hubs in subgraph: [(7071390, 0.0052019841605045235), (6982366, 0.005200033113645647), (7071389, 0.005187275821457385), (7119258, 0.005179310165831523), (7005564, 0.0051723889076598405)]
Top authorities in subgraph: [(5523520, 0.1602980087442528), (5367109, 0.14231195658948897), (5304719, 0.13996625528001524), (5850009, 0.13300081298227423), (5968830, 0.08253520695546829)]
The first item in the list is a patent number followed by the hub/authority scores.
The plot of the community shows the hubs and authorities at the centre of the sub-network. One can also observe several concentric layers in the sub-network, which may indicate generations of innovation as the technology develops over time.
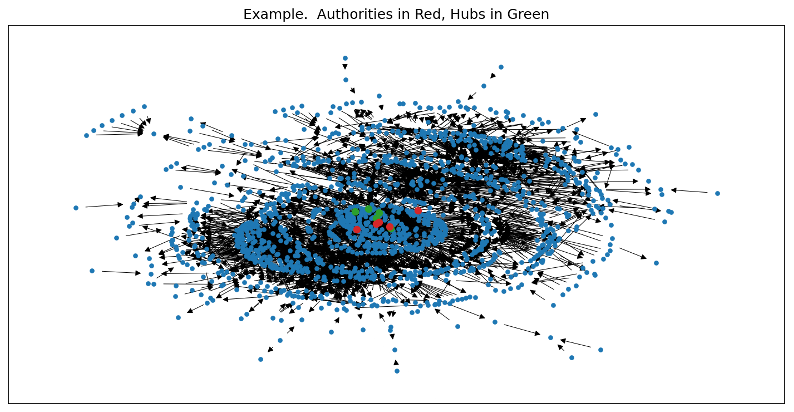
The algorithm seems to find patents that are relevant and important. The sample contains patents related to plant breeding technologies. For example, one of the key authorities is patent US5367109 – Inbred corn line PHHB9. The example can be seen here: https://patentscope.wipo.int/search/en/detail.jsf?docId=US38313870
This node has an in-degree of 175, indicating that it has been cited many times, which supports the assertion that it is an important foundational innovation.
The plot below shows a relatively small community with only 31 nodes. This is reproduced here to show a typical structure of the network at a very low level.
Conclusions
We have shown that patent citation networks have similar structure to comparable networks such as academic citations or web pages. We have measured in-degree, out-degree, degree distribution, connectedness, clustering. The conclusion is that patent citation networks are well structured and well suited to further analysis. Clustering analysis was not relevant since this kind of network is not highly clustered by its nature.
We then used Louvain community detection to partition the network. According to the multinomial statistical test, this partitioning created communities with patents in similar technical fields. The modularity metric for the Louvain partitioning was very high, indicating that the communities were tightly inter-connected with relatively few linkages to other communities. This allows us to draw some tentative conclusions about the nature of technological development – namely that there is a lot of information circulating within a technology field, but not a high degree of spillovers of technological information into different technical fields.
Finally, we were able to use the hubs and authorities algorithm to identify some candidates for high-value patents within the network. Although it was not possible to systematically evaluate these results, the samples that were chosen look like relevant and important results.
Further Considerations
This study is an initial analysis of patent citation networks using modern network analysis. It has shown that further work may be productive. The following could be considered:
- The citation data is not sufficient to identify technology domains because the Louvain communities are quite unevenly distributed. It would be better to use more data and train a classifier using other methods, perhaps including the citation data as one feature. We would not use the Louvain algorithm to partition the data, but we could still measure modularity to learn about the partitioning.
- It would be interesting to look at characteristics of different technology fields. For example, do some technologies have higher degree nodes, indicating more inter-connected innovations? When do spillovers happen from one technology field to another.
- What is the time dimension of the evolution of the network? Has it become more connected, has the degree distribution changed, etc?
- Can the study be expanded beyond US patents? Can we learn about the development of technologies in different countries, compare their strengths and weaknesses, and look for evidence of collaboration or spill-over effects between countries?
