Introduction
A few years ago, I read Tony Seba’s book Clean Disruption. I got very optimistic because it seemed like the clean energy transition was starting and that we were at the beginning of an ‘s-curve’ of adoption that would result in rapid adoption of clean technologies. The transition to clean energy vehicles would mirror the transition from horses to cars that took only about 10 years in the early 1900s. Problem solved.
10 years later, it still hasn’t happened. There is a lot of hype, and a lot of over-priced and over-engineered vehicles on the market. Where are all the electric cars anyway? When I stop at a motorway rest stop, all the Tesla superchargers are vacant. There is still a queue at the petrol station. Apparently the Tesla Model Y is the biggest selling car in Switzerland, but I don’t see many on the street.
It seems like Tony Seba’s s-curve is not working as expected. So let’s get some data and figure out what’s really happening.
The Data
The Swiss Federal Office of Statistics publishes data on vehicle registrations broken down by various categories. I downloaded the data on the stock of vehicles by year of registration and the new registrations by motorisation type.
Why Switzerland?
- The data is quite good quality.
- There are few distortions in the data. Unfortunately there are almost no incentives for clean energy vehicles so the data accurately represents personal choices and market forces.
- Most people are not as rich as you might think, so the market shares of different vehicles are representative of European countries in general.
- I live here.
I have done some data pre-processing. In particular, I have combined the different types of Hybrid vehicle into 1 category (includes traditional plus plug-in hybrid, petrol and diesel variants). Within this category, the proportions are changing to favour plug-in hybrid, but overall I believe that the whole category is a transition technology that should phase out over time.
We are only looking at passenger cars. This analysis does not consider commercial vehicles or public transport.
The Questions
- What are the trends in new vehicle purchases by motorisation type?
- How fast is the transition occurring and what are the long-term projections?
- What policy changes might the government consider?
- How much carbon is this displacing anyway?
First Look
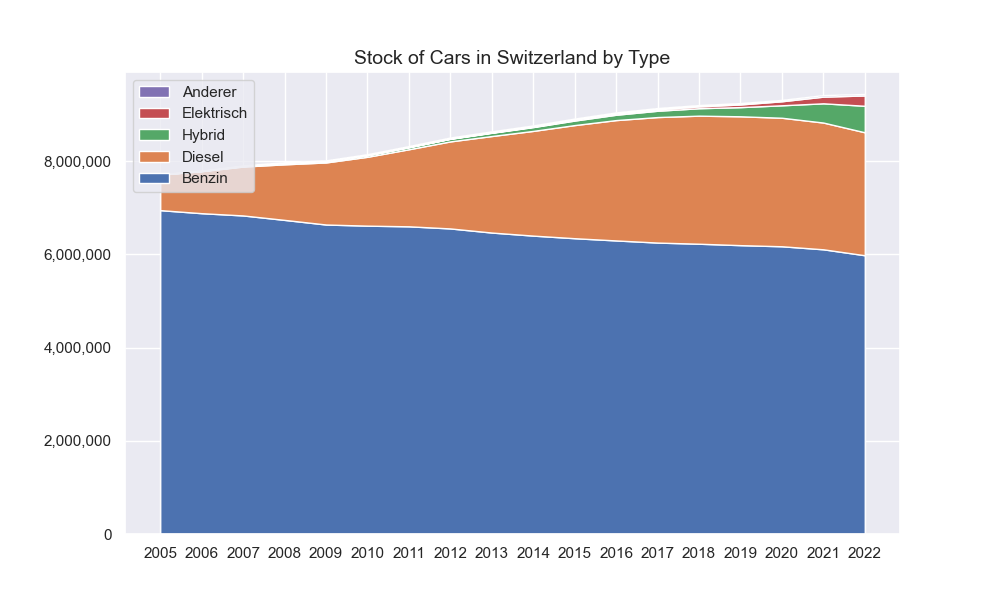
There are 9.5 million passenger vehicles in Switzerland (population 8.8 million !?) and the numbers have been increasing, although the growth rate is slowing down.
One can observe the share of diesel surge and then decrease. Diesel is becoming less popular, but it is still an attractive option due to low running costs.
The shares of the total stock of vehicles at the end of 2022 were:
| Petrol | 63% |
| Diesel | 28% |
| Hybrid | 6% |
| Electric | 2.3% |
| Other | <1% |
Clearly, the transition is still at the very early stages of the s-curve.
New registrations in 2022 are more encouraging. Hybrid and Electric already have 51% market share for new vehicles:
| Petrol | 37% |
| Diesel | 12% |
| Hybrid | 33% |
| Electric | 18% |
| Other | <1% |
The other factor to consider is the ‘churn rate’, or the number of vehicles that are retired each year. This is shown, in percentage terms, in the figure below.
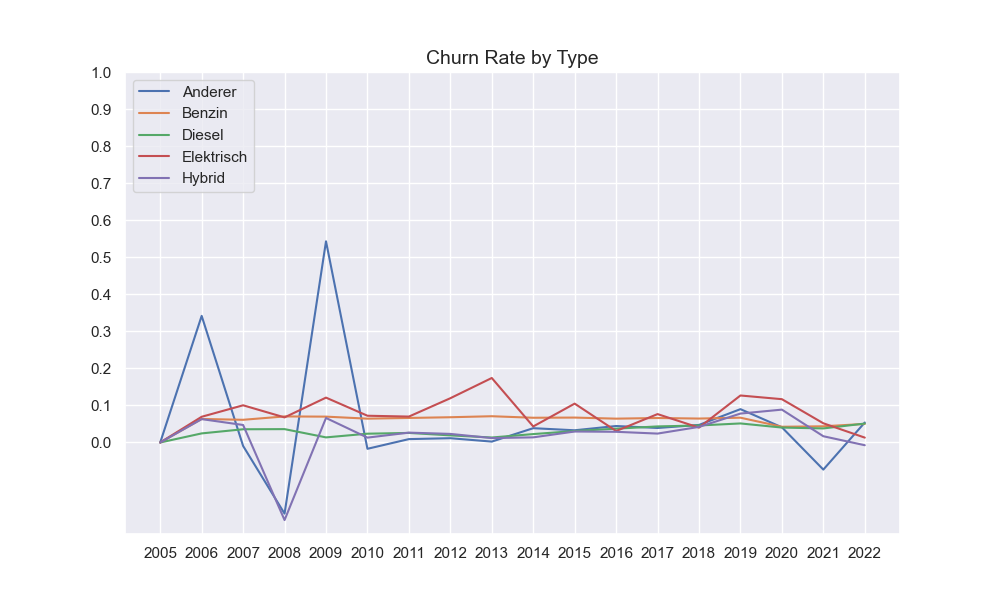
A concern with these figures is that the churn rate for diesel is relatively low and for electric it has been relatively high. This means that, even if consumers are purchasing more electric cars, they are retiring them much earlier than their diesel cars.
Overall, the average churn rate is 5.4% and we will use this number in the modelling below.
Modelling and Predicting
We will model the transition over time with 3 components.
- First, the churn rate is used to retire 5.4% of older vehicles every year.
- Then we predict the total number of new registrations. This is a simple least-squares regression assuming a linear trend. The trend in recent years appears more quadratic, but that may be due to a market slowdown in 2020-2022 and a quadratic regression would predict a rapid decline in new registrations. The linear fit predicts a slow linear decline.
- Finally, we need to predict the proportion of new registrations by motorisation type.
- Then add the components together to predict the total stock and mix of motorisation types from 2023 to 2050.
For the proportion of motorisation types, we assume an s-curve transition for each type. To model this non-linear trend, we assume that the s-curve follows a sigmoid function. The sigmoid function is:
$$y=\frac{1}{1+e^{-x}}$$
This function takes any real value for x and returns a value between 0 and 1.
First we transform our data from 0-1 values to a linear scale using the inverse sigmoid function:
$$x=log \left( \frac{y}{1-y} \right)$$
Then we run an ordinary least squares regression on the transformed data, predict the future values, and transform back to 0-1 values using the sigmoid function. The results are shown below:
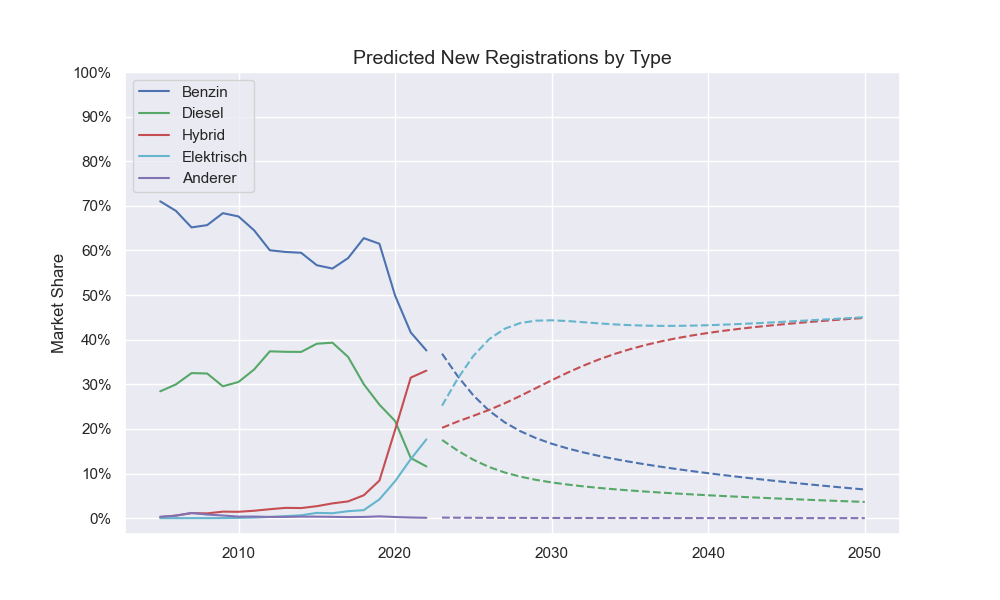
The predictions for market share follow s-curves as desired. No further modelling assumptions have been made here. In particular, we do not assume that the hybrid market share should decline – it’s not shown in the data so we don’t force that assumption.
Putting it all together, we can predict the total number of vehicles by motorisation type from 2023 to 2050.
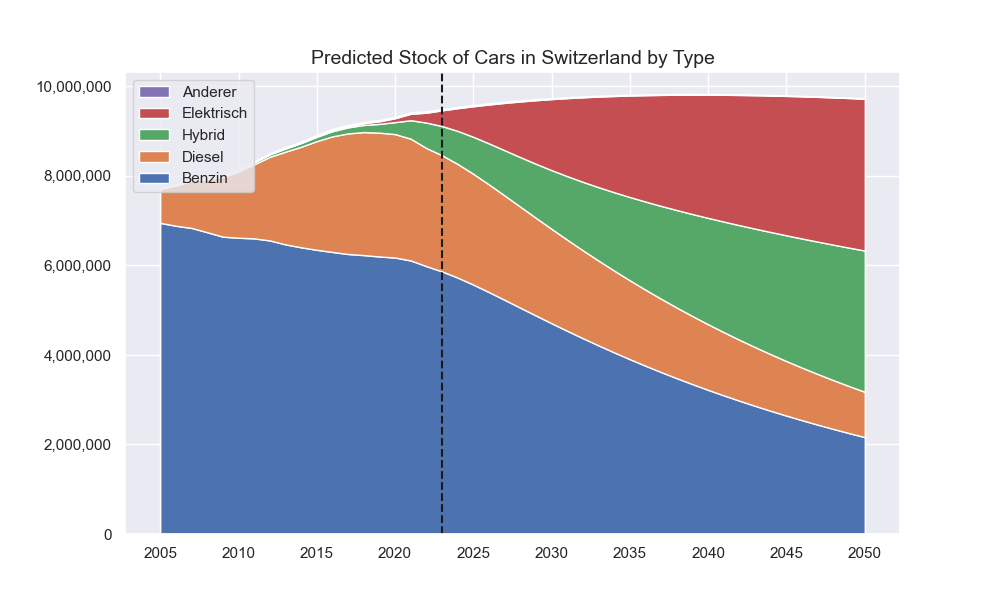
According to this model, we reach ‘peak car’ in Switzerland in 2040 with 9.8 million cars.
The final proportions in 2050 are:
| 2022 | 2050 |
| Petrol | 63% | 22% |
| Diesel | 28% | 10% |
| Hybrid | 6% | 32% |
| Electric | 2.3% | 35% |
| Other | <1% | <1% |
The total ‘electrified’ share of the market grows from 8.3% to 68%. However, there are still 32% fossil fuelled vehicles on the road in 2050, or nearly 3.2 million vehicles.
Carbon Neutral ?
The EU and other regulatory agencies are setting targets for CO2 emissions for new vehicles. The current average CO2 emissions per Km are around 108 g/Km, although this figure includes full electric vehicles which have 0 emissions according to the WLTP standard (doesn’t count production emissions). The average car in Europe drives 18,000 km per year which means around 2 tonnes of CO2 per fossil fuelled car in Europe.
We can now estimate the carbon impact of our vehicle fleet in Switzerland. We will be generous and assume that the hybrid cars achieve a 50% reduction in emissions and that full electric cars achieve 100%.
| Tonnes CO2 | 2022 | 2050 |
| Petrol | 11,964,368 | 4,328,428 |
| Diesel | 5,277,348 | 2,024,320 |
| Hybrid | 568,834 | 3,154,918 |
| Electric | 0 | 0 |
| Total : | 17,810,550 | 9,507,666 |
We have a 47% reduction in direct CO2 emissions after 30 years. If we are generous and assume that hybrid cars will be totally replaced by full electric, then we could achieve 63% reductions. Not bad, but nowhere near net-zero.
Note again, this does not take into account production emissions, electricity sources, etc.
Reflections
Tony Seba predicted that conventional cars would be obsolete by 2030, as well as most uses of oil, gas and coal. Not happening.
On the other hand, the world needs to get to net-zero by 2050 and significantly reduce CO2 emissions by 2030. Passenger vehicles seem like an easy part of the equation to get right because we already have all the technology we need to make the transition. But with the current policy settings, we will still be only half-way there by 2050. And we haven’t even looked at the difficult transitions, such as commercial vehicles, electricity generation, industrial processes, etc.
The market may even work against the transition as the demand for oil peaks and the fossil industry faces over-capacity while resource constraints make electric batteries relatively expensive. Consumers may find that it is relatively cheap to keep the old petrol or diesel car running for another 5 years instead of replacing it.
New policy initiatives are needed:
- Create incentives, such as steeply progressive emissions taxes, to encourage car owners to retire their higher-emission vehicles.
- Create incentives for manufacturers to produce practical and more affordable vehicles. For example, close the loopholes in safety regulations for large SUVs; give tax incentives to lower-income buyers.
- Moratorium on all fossil vehicles sales after 2030. Current EU regulations ban fossil vehicle sales after 2035, but the industry is lobbying to find ways to wiggle out of it.
But the problem with an electric car is that it is a car. It is still an expensive, wasteful, over-engineered solution to carry a bag of groceries across town or drop off children at school. More cars create more congestion and inefficient transport systems. And the supporting industry creates CO2 emissions.
In 1980, 35% of personal vehicles were motorcycles and mopeds. This dropped to 21% by 2022 but the number of mopeds (which includes speed electric bikes) increased again by 12% since 2020. This indicates a latent demand for alternative transport solutions. Electric bikes are a cheap and efficient solution for most urban transport needs, especially the cargo bike varieties that are proving to be good solutions for transporting groceries and children. A recent study shows that 280 million e-bikes in the world are already displacing 4x as much demand for oil as electric vehicles.
E-bikes have taken off since 2020 for several reasons. Firstly, the technology has developed so that e-bikes are now relatively cheap and efficient and there are more options available, such as cargo bikes designed for families. Secondly, many cities (in Europe) have created cycling infrastructure to make cycling safer. Thirdly, the pandemic changed peoples preferences since they prefer not to use crowded public transport where the risk of transmitting diseases is higher.
So here are the real policy initiatives that are needed, in addition to encouraging the early retirement of fossil vehicles:
- Create dedicated cycling infrastructure in cities to make cycling a safe choice.
- Create efficient and extensive public transport networks, including park&ride facilities to move commuters from private cars to other transport system in cities.